Controls
Leftclick + Mousemove: Rotate
Scroll: Zoom
Rightclick + Mousemove: Move
Shift+Scroll: Adjust clipping-plane
Ctrl+Leftclick on residue: Select residue
Ctrl+Leftclick on empty space: Deselect residue
Structure coloring
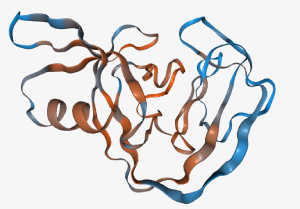 The structure is colored according to the probability that the split sites are active (blue) and inactive (red).
Residue selection
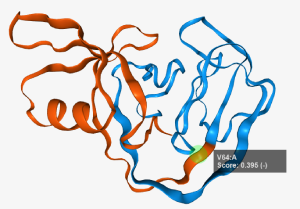 Residues can be selected via Ctrl+Leftclick (a green sphere will show the selection) which treat the selected residue as the site where the protein is split. The split occurs after the selected residue.
Additionally the two split fragments are shown with two colors (red and blue).
Selected residues can be deselected via Ctrl-Leftclicking anywhere but on a residue. A tooltip will appear when
hovering the mouse over the residue. The residues' chain information is displayed after a colon.
Residues can be selected via Ctrl+Leftclick (a green sphere will show the selection) which treat the selected residue as the site where the protein is split. The split occurs after the selected residue.
Additionally the two split fragments are shown with two colors (red and blue).
Selected residues can be deselected via Ctrl-Leftclicking anywhere but on a residue. A tooltip will appear when
hovering the mouse over the residue. The residues' chain information is displayed after a colon.
Additional features
 The current camera view can be saved via this button.
 The size of the structure window can be resized via this button.
Groups of split sites
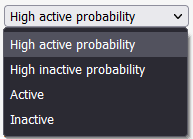 Different groups of split sites can be selected outputting a list of split sites ordered from the highest activity probability to lowest.
The high active probability group encompasses sites with a activity probability of at least 0.6. The high inactive probability encompasses sites with a activity probability of less than 0.4.
The active and inactive groups have all sites that the model would predict to be active (at least 0.5) and inactive (less than 0.5) respectively.
Different groups of split sites can be selected outputting a list of split sites ordered from the highest activity probability to lowest.
The high active probability group encompasses sites with a activity probability of at least 0.6. The high inactive probability encompasses sites with a activity probability of less than 0.4.
The active and inactive groups have all sites that the model would predict to be active (at least 0.5) and inactive (less than 0.5) respectively.
Additional features
 The list can be copied to the clipboard with this button.
Additional information
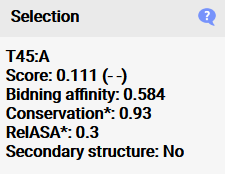 When a residue is selected, additional information concerning the conservation,
binding affinity, surface accessibility and secondary structure properties are shown here which are used to calculate the activity probability in the model. It is important to note that
conservation and surface accessibility are given as means of the surrounding residues of the split site, as this was shown to work best for predicting the activity,
so the values do not show single residue values (which can be accessed in the raw files) (*). The split site is considered to be in a secondary structure if both flanking residues of the split site are in
a secondary structure region.
When a residue is selected, additional information concerning the conservation,
binding affinity, surface accessibility and secondary structure properties are shown here which are used to calculate the activity probability in the model. It is important to note that
conservation and surface accessibility are given as means of the surrounding residues of the split site, as this was shown to work best for predicting the activity,
so the values do not show single residue values (which can be accessed in the raw files) (*). The split site is considered to be in a secondary structure if both flanking residues of the split site are in
a secondary structure region.
Deselection
 Deselecting residues can be done in the structure view or with this button located at the top of the Data tab.
Multiple files
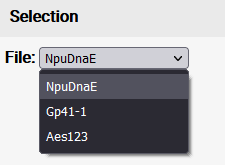 If multiple files were uploaded via batch upload, the single files can be selected via a dropdown menu.
Data graphs
Residues on the graph can be clicked on which will also show the selection in the structure view. Zooming can be done via clicking and holding the mouse
at the start of the desired region and moving the mouse towards the end of the desired region. If the graph is zoomed in, it can be moved by holding Shift
and dragging with the left mouse button. All graphs are color coded according to the activity probability (red = low probability, blue = high probability of being active).
Deselecting residues can be done in the structure view or with this button located at the top of the Data tab.
 Zooming out can be done via a double-click on the graph or via this button that appears at the top-left of the graph (if it is zoomed in).
Predictions
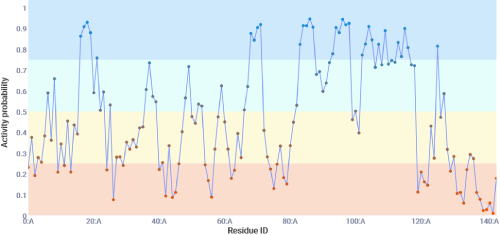 This tab shows the models prediction for each possible split site. There are 4 categories given with 4 colors.
Generally speaking the model predicts split sites with a probability of at least 0.5 to be active and below 0.5 to be inactive. Sites with a probability of at least 0.75 have been shown to
contain the highest ratio of true positives to false positives at the dispense of loosing some true positive split sites. Sites with a probability of less than 0.25 have been shown to
contain the highest ratio of true negatives to false negatives.
This tab shows the models prediction for each possible split site. There are 4 categories given with 4 colors.
Generally speaking the model predicts split sites with a probability of at least 0.5 to be active and below 0.5 to be inactive. Sites with a probability of at least 0.75 have been shown to
contain the highest ratio of true positives to false positives at the dispense of loosing some true positive split sites. Sites with a probability of less than 0.25 have been shown to
contain the highest ratio of true negatives to false negatives.
Logit
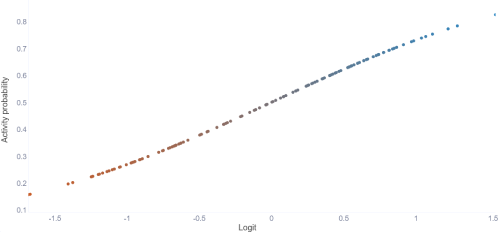 This tab shows the logit function, which what the model's prediction is based on. The points are sorted by the lowest prediction to the highest (Meaning the splits are not in order like with the other tabs).
Binding affinity, conservation, surface accessibility and secondary structure
Those four properties are used to calculate the activity probability. The binding affinity gives the affinity between the two fragments towards each other.
The conservation and surface accessibility is given by the surrounding residues of the split site.
Sequence
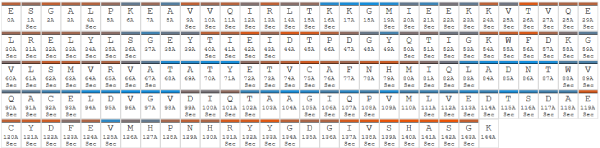 The sequence tab shows the sequence with the activity probability color codes,
residue id's and whether the residue belongs to a secondary structure region (marked with Sec).
The sequence tab shows the sequence with the activity probability color codes,
residue id's and whether the residue belongs to a secondary structure region (marked with Sec).
Download
 The raw data can be downloaded in this tab as a zip file.
The zip contains the output from DSSP, hmmer, muscle and rate4site as well as the pdb file that was generated through pdb2pqr at a pH of 7.
The raw data can be downloaded in this tab as a zip file.
The zip contains the output from DSSP, hmmer, muscle and rate4site as well as the pdb file that was generated through pdb2pqr at a pH of 7.